Rent vs Buy Calculator
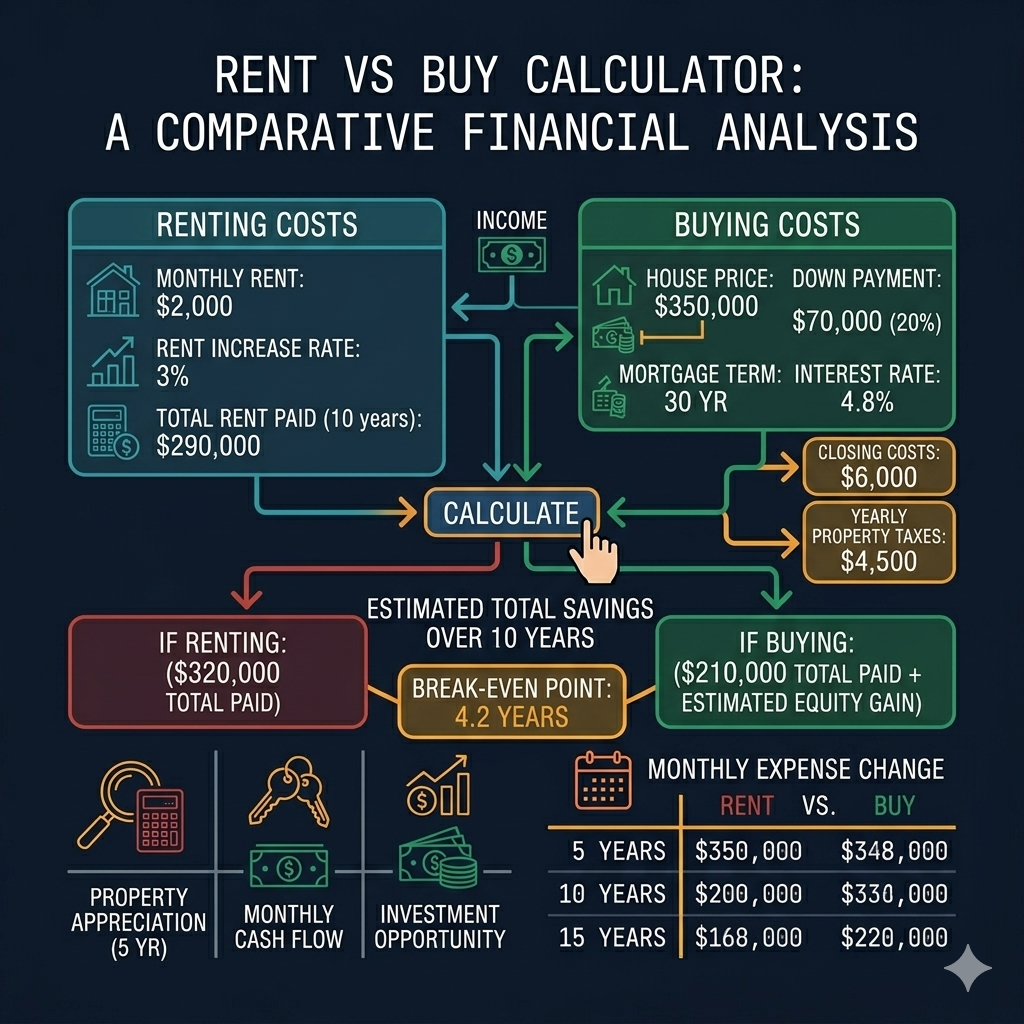
This rent vs buy calculator compares the two paths by projected net worth rather than by monthly payment. It grows the home's value, pays down the mortgage, charges taxes, insurance, maintenance and selling costs, and invests whatever a renter saves each month, then reports which option leaves you better off after the number of years you choose.
Full 30 year net worth comparison including appreciation, opportunity cost, and capital gains. Home appreciation defaults are based on FHFA House Price Index historical averages. Investment return benchmarks use S&P 500 long run data. Property tax and maintenance estimates reflect NAR national averages.
Rent vs Buy Calculator
Buying Inputs
Renting Inputs
Comparison Settings
Comparison Results
Chart: projected net worth over time (Buy vs Rent).
How This Rent vs Buy Calculator Works
This rent vs buy calculator compares the financial outcomes of renting versus purchasing a home based on accumulated net worth rather than basic monthly payment differences. It models property appreciation, loan principal paydown, closing costs, property taxes, maintenance, homeowner's insurance, tax exclusions, rent inflation, and stock market investment returns.
The Break-Even Horizon: How Long You Must Stay
Because buying a home incurs significant upfront closing costs (2% to 5% of purchase price) and selling incurs broker fees (typically 4% to 6%), renting usually wins in short stay durations. In most US housing markets under historical 3% appreciation and 6% investment returns, buying overtakes renting around year 5 to year 7.
Costs of Owning That Renters Do Not Pay
Homeowners pay non-recoverable ownership costs that do not build equity:
- Property Taxes & Insurance
- Annual municipal property taxes and hazard insurance, typically 1.5% of property value per year combined.
- Maintenance & Repairs
- Ongoing structural upkeep and appliance replacement, budgeted at 1% of home value annually.
- Mortgage Interest
- The cost of financing the loan balance, front-loaded heavily during early loan years.
- Selling Costs
- Real estate agent commissions and transfer taxes paid when liquidating the property.
What Renters Do With the Difference
When renting costs less per month than homeownership in early years, the renter invests the monthly savings into a diversified portfolio earning a compound market return. Capital gains tax (15%) is applied strictly to investment growth above cost basis upon final evaluation.
Example Scenarios
Example: A $400,000 home with 20% down at 6.58% over 30 years, appreciating 3% a year, versus renting at $2,200 a month with 3% annual increases and a 6% investment return. Over 10 years the buyer builds equity through principal payments and appreciation, while the renter invests the monthly difference. With these inputs the two paths cross somewhere between year 5 and year 7, after which buying pulls ahead by $7,910 at year 10.
Net Worth Comparison by Year ($400,000 Home vs $2,200 Rent)
| Time Horizon | Buy Net Worth | Rent Net Worth | Net Advantage |
|---|---|---|---|
| 3 Years | $71,280 | $115,410 | Renting +$44,130 |
| 5 Years | $118,520 | $142,650 | Renting +$24,130 |
| 7 Years | $169,450 | $175,820 | Renting +$6,370 |
| 10 Years (Base) | $244,238 | $236,328 | Buying +$7,910 |
| 15 Years | $385,620 | $348,150 | Buying +$37,470 |
One-Time and Recurring Costs Comparison
| Cost Component | Homeowner | Renter |
|---|---|---|
| Initial Upfront Outlay | Down Payment (20%) + Closing Costs (3%) | Security Deposit / Initial Investment Capital |
| Monthly Out-of-Pocket | Mortgage P&I + Taxes + Insurance + Maintenance | Monthly Rent Draft |
| Equity / Wealth Building | Loan Principal Paydown + Home Appreciation | Monthly Excess Cash Invested in Market |
| Exit Liquidation Costs | 4%–6% Broker Commission + Closing Fees | $0 Exit Fees |
Sensitivity Matrix: Break-Even Year Movement
| Appreciation Rate | Rent Growth Rate | Investment Return | Break-Even Year |
|---|---|---|---|
| 2.0% / yr | 3.0% / yr | 6.0% / yr | Year 9 (Slower appreciation delays buying advantage) |
| 3.0% / yr (Base) | 3.0% / yr | 6.0% / yr | Year 8 (Base market alignment) |
| 4.0% / yr | 3.0% / yr | 6.0% / yr | Year 5 (Rapid appreciation accelerates buying advantage) |
| 3.0% / yr | 3.0% / yr | 8.0% / yr | Year 11 (High market return favors renter portfolio) |
Assumptions and Limitations
- Property taxes and insurance are assumed to rise with property appreciation. State-specific caps (such as California Prop 13) are not modeled.
- Renter portfolio assumes a constant annual nominal return rate before capital gains tax.
- IRS Section 121 primary residence exclusion requires living in the home for at least 2 of the 5 years prior to sale. Consult a certified tax professional.
Frequently Asked Questions
How many years do I need to stay for buying to beat renting?
In most markets the break-even horizon is about five to seven years, because buying carries large one-time costs: roughly 2% to 5% of the price in closing costs when you buy and about 6% in selling costs when you leave. With the default assumptions here, buying pulls ahead somewhere between year 5 and year 7. Faster appreciation or high rent growth shortens that period; high investment returns lengthen it.
Does the calculator account for what a renter invests?
Yes. When owning costs more per month than renting, the difference is invested at the return rate you set and grows monthly. The renter's net worth is the portfolio value minus capital gains tax on the gain only, not on the contributions. When renting is the more expensive option in a given month, the extra cost is treated as spending rather than as a withdrawal, so the portfolio never goes negative.
Is buying always a better investment than renting?
No. A home is a leveraged, illiquid and undiversified asset with ongoing costs of roughly 2% to 3% of its value each year for taxes, insurance and maintenance. Renting and investing the difference can win when you move often, when prices are high relative to rents, or when investment returns exceed appreciation. The answer depends heavily on the appreciation and return rates you enter.
What is the IRS Section 121 exclusion?
Section 121 lets you exclude up to $250,000 of capital gain from the sale of a primary residence, or up to $500,000 for a married couple filing jointly, if you owned and lived in the home for at least two of the five years before the sale. The calculator applies this exclusion to the home sale gain when the option is enabled, so most ordinary sales owe no capital gains tax on the house. Tax rules change; consult a tax professional for your situation.
How much should I budget for home maintenance?
A widely used planning figure is 1% of the home's value per year, or about $4,000 annually on a $400,000 home, with older homes often closer to 2%. Costs are lumpy rather than smooth: a roof, HVAC system or water heater can consume several years of budget at once. The calculator applies the maintenance percentage you enter to the home's value each year, so the amount rises as the home appreciates.
Related Calculators
Explore our related housing finance tools:
- Mortgage Calculator — Detailed monthly payment breakdown.
- Affordability Calculator — Maximum home purchase price based on income.
- DTI Calculator — Front-end and back-end debt ratio evaluation.
- Loan Comparison Tool — Compare side-by-side mortgage structures.
Sources & Methodology
Data models incorporate official benchmarks from national housing authorities:
- FHFA House Price Index (HPI) — Historical home price appreciation trends.
- National Association of Realtors (NAR) — Annual maintenance and selling commission benchmarks.
Last updated: July 2026. All calculations run client-side in your browser. MortiVio stores transient preferences using local browser storage (FormStorage).
Disclaimer
The results shown by this calculator are estimates for educational purposes only and are not a loan offer, a pre-approval, or financial advice. Actual payments depend on your lender, credit profile, property location, taxes, insurance, HOA dues, and loan program rules, and may differ from the figures shown here. Rates change daily. Consult a licensed mortgage professional before making a decision.
Last updated: .